

Sustainability performance management
See and interpret your sustainability performance
VerdaMetric makes sustainability performance management easier by giving you a clear view of emissions, data completeness, trends, targets and key metrics across your organisation.
Use sustainability dashboards and carbon analytics to monitor performance across sites and reporting periods, compare results over time and see where progress is being made. Financial insight adds further context by showing the estimated cost per tonne of CO2e saved for reduction initiatives, helping you compare potential actions alongside their emissions impact.
See what your sustainability data is telling you
Collecting sustainability data is only useful if you can make sense of it. As reporting years, sites and datasets grow, it can become harder to see the overall picture or spot the changes that matter.
VerdaMetric turns your existing data into dashboards and analytics that make sustainability performance management easier to navigate. See emissions, trends, data completeness, intensity metrics and target progress without having to pull information together manually each time you want an update.
With current and previous reporting periods available in the same platform, you can look beyond a single carbon footprint and see how performance is developing over time.
Key capabilities

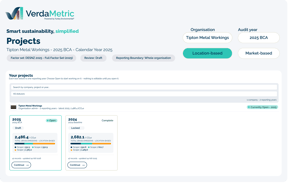
View emissions, data collection progress, intensity metrics and other key indicators through dashboards designed to give you a clear picture of sustainability performance.

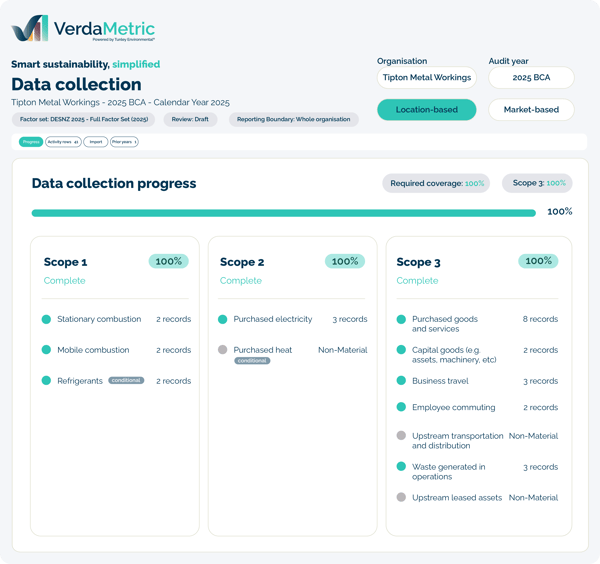
See how data collection is progressing and identify where information is still outstanding across your organisation.

Compare current and historic emissions to see how your carbon performance is changing between reporting periods.

Explore results across different sites and areas of your organisation to identify where emissions and performance differ.

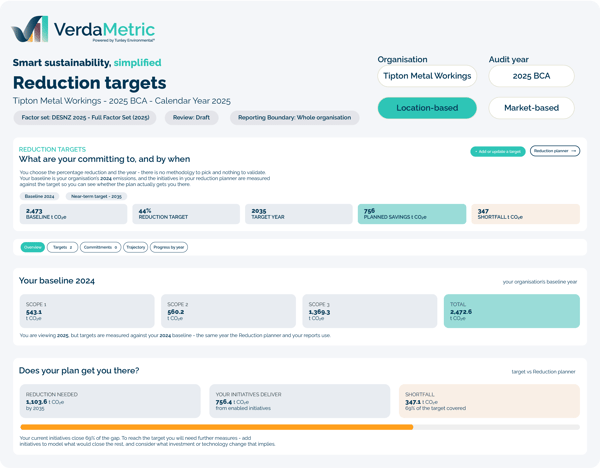
Put absolute emissions into context using relevant intensity measures and monitor progress against your organisation’s carbon targets.

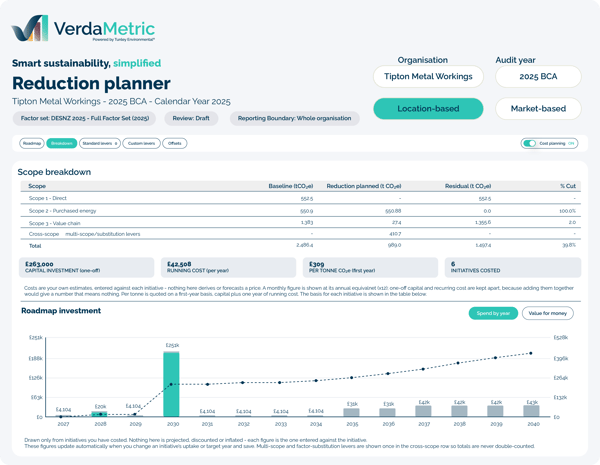
Understand the estimated cost per tonne of CO2e saved for reduction initiatives, adding financial context when comparing potential actions.
Bring your sustainability KPIs into one dashboard
A carbon footprint gives you an important headline figure, but it doesn’t tell you everything about how your organisation is performing.
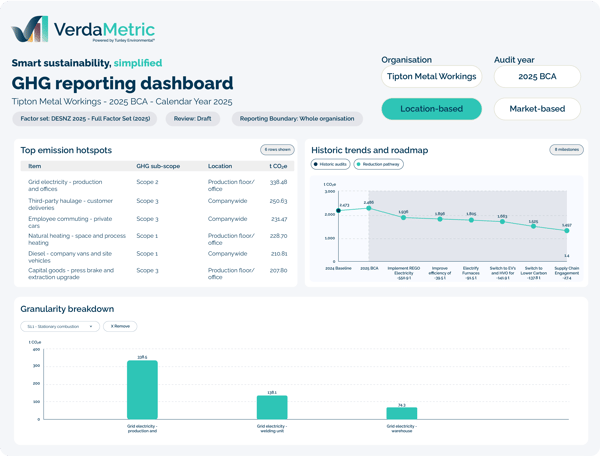
VerdaMetric’s sustainability KPI dashboard brings key information into view, including emissions by scope and category, intensity metrics, data collection progress and previous reporting periods.
Rather than waiting until the end of the reporting year to assess performance, your sustainability dashboard gives you an ongoing view of the information already held within the platform.
Monitor carbon performance over time
Performance becomes more meaningful when you can see how it is changing. VerdaMetric supports sustainability performance monitoring across reporting periods, allowing you to compare current emissions with previous years and follow longer-term trends.
Carbon analytics provide another way to interpret those results, helping you see where emissions have increased, decreased or remained relatively stable and where further investigation may be useful.
This gives sustainability performance management a longer-term perspective rather than treating each reporting year in isolation.
Put your emissions into context
Absolute emissions are important, but they don’t always tell the full story. Changes in production, revenue, headcount or other business activity can affect the way carbon performance should be interpreted.
Intensity metrics provide additional context by relating emissions to relevant organisational measures. Alongside target progress, they give you another perspective on whether performance is moving in the direction your organisation expects.
Used alongside your carbon emissions dashboard, these measures make it easier to interpret changes rather than relying on the total emissions figure alone.
Compare the cost of reduction initiatives
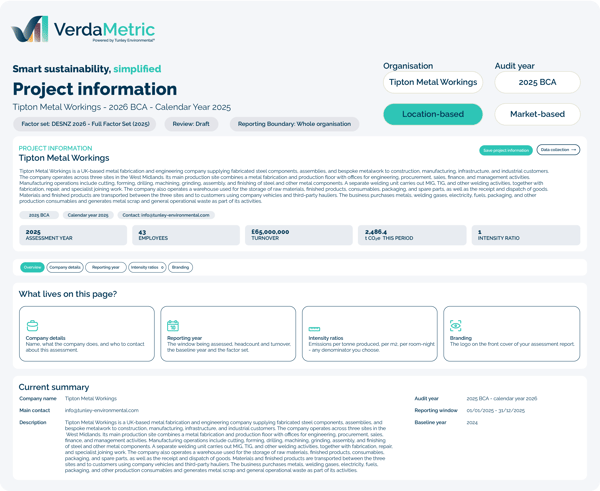
Reduction planning is not only about understanding the potential emissions saving. VerdaMetric can also calculate the estimated cost per tonne of CO2e saved using the total cost entered for a reduction initiative and its modelled emissions saving. This helps you compare potential actions from both a carbon and financial perspective.
This adds useful context when reviewing performance and considering future priorities, allowing carbon and financial information to form part of the same conversation.
Keep an eye on data completeness
Performance insights are only as useful as the information behind them. If parts of the organisation are still missing data, it is important to know before drawing conclusions from the results.
VerdaMetric shows data collection progress alongside other performance information, making gaps easier to identify during the reporting year.
For teams managing information across multiple sites or contributors, this provides a practical way to see what has been completed, what is still outstanding and where follow-up may be needed.
From sustainability data to clearer decisions
Sustainability performance management is about more than looking at a dashboard. The value comes from being able to interpret what has changed and use that information when deciding what happens next.
VerdaMetric carries the data collected throughout the reporting year into dashboards, comparisons and performance insights. You can see where you are now, how that compares with previous results and how performance relates to your wider targets.
Those insights can then feed into reporting, reduction planning and future sustainability priorities without starting again with a separate set of data.
