

Carbon accounting software
Calculate, understand and track your emissions
VerdaMetric’s carbon accounting software brings your emissions data and calculations together, helping you calculate Scope 1, 2 and 3 emissions and understand where your organisation’s carbon footprint is concentrated.
Explore emissions across sites, scopes, categories and reporting years, with clear calculation records connecting activity data to the emission factors used.
Bring structure to your carbon accounting
Calculating an organisational carbon footprint can involve large volumes of activity data, different emission factors and information collected from across multiple parts of the organisation.
VerdaMetric provides a structured environment for carbon accounting, keeping activity data, emission factors and carbon calculations connected within the platform.
Calculate and organise greenhouse gas emissions across Scope 1, 2 and 3, while maintaining visibility of the data and methodology behind the results.
VerdaMetric’s carbon accounting software keeps emissions calculations structured so that they can be reviewed, reported and tracked over time.
Key capabilities

Calculate emissions across Scope 1, Scope 2 and Scope 3, with data organised by scope, category, site and reporting year.

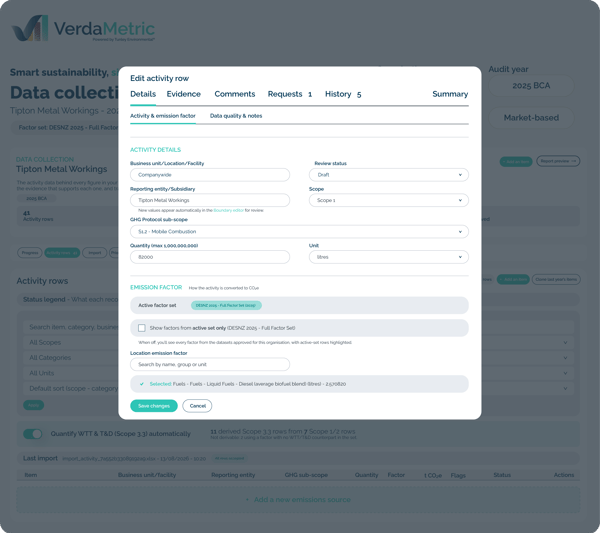
Connect activity data to controlled, reporting year specific emission factors, keeping the factors used within your calculations clear and traceable.

Calculate emissions from activity data while maintaining a clear connection between the original data, units, emission factors and resulting calculations.

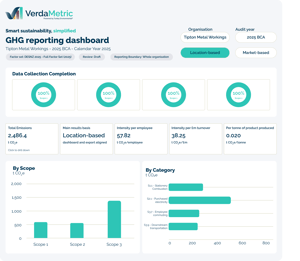
Explore greenhouse gas emissions by site, scope and category to understand where emissions are concentrated across your organisation.

Calculate Scope 2 emissions using location- and market-based approaches for purchased energy emissions.

Put absolute emissions into context using relevant intensity metrics to better understand carbon performance across your organisation.
Calculate Scope 1, 2 and 3 emissions
VerdaMetric supports structured data collection and calculations across all scopes and specifically supports location- and market-based Scope 2 reporting and Scope 3 relevance screening across the 15 GHG Protocol categories.
VerdaMetric keeps emissions information structured by scope, category, site, and reporting year, providing a consistent view of your organisational carbon footprint.
Calculate direct greenhouse gas emissions from sources owned or controlled by your organisation.

Calculate emissions associated with purchased energy, with support for both location-based and market-based Scope 2 reporting.

Organise and calculate relevant indirect emissions across the Scope 3 categories, including supplier data where available.
Keep emission factors connected to your calculations
Carbon calculations depend on the data and emission factors behind them. VerdaMetric’s carbon accounting software uses controlled and versioned emission factor libraries, including reporting year specific factor sets, helping keep calculation methods consistent and traceable.
Factor mappings, unit checks and calculation records keep the methodology behind your results visible. Suggested emission factors remain subject to human approval, giving users control over the factors applied to their calculations.
Understand your emissions from different perspectives
Once emissions have been calculated, VerdaMetric allows you to explore the results across different areas of the business. Explore sustainability performance management to see how dashboards, trends and performance insights help you monitor these results over time.
.png?width=300&name=VM%20background%20pattern%20V4%20(1).png)
Understand how Scope 1, 2 and 3 emissions contribute to your overall carbon footprint and explore the categories behind them.
.png?width=300&name=VM%20background%20pattern%20V4%20(2).png)
Compare emissions across different sites and areas of your organisation.
.png?width=300&name=VM%20background%20pattern%20V4%20(3).png)
View previous reporting years alongside current emissions to understand how your carbon footprint is changing over time.
.png?width=300&name=VM%20background%20pattern%20V4%20(4).png)
Add context to absolute emissions by monitoring relevant intensity measures.
From carbon calculations to reporting and action
Your carbon footprint provides the foundation for more than an annual emissions figure.
Once calculated and structured within VerdaMetric’s carbon accounting software, emissions information can support data quality review, performance monitoring, reporting and compliance, and future reduction planning.
